Table of Contents
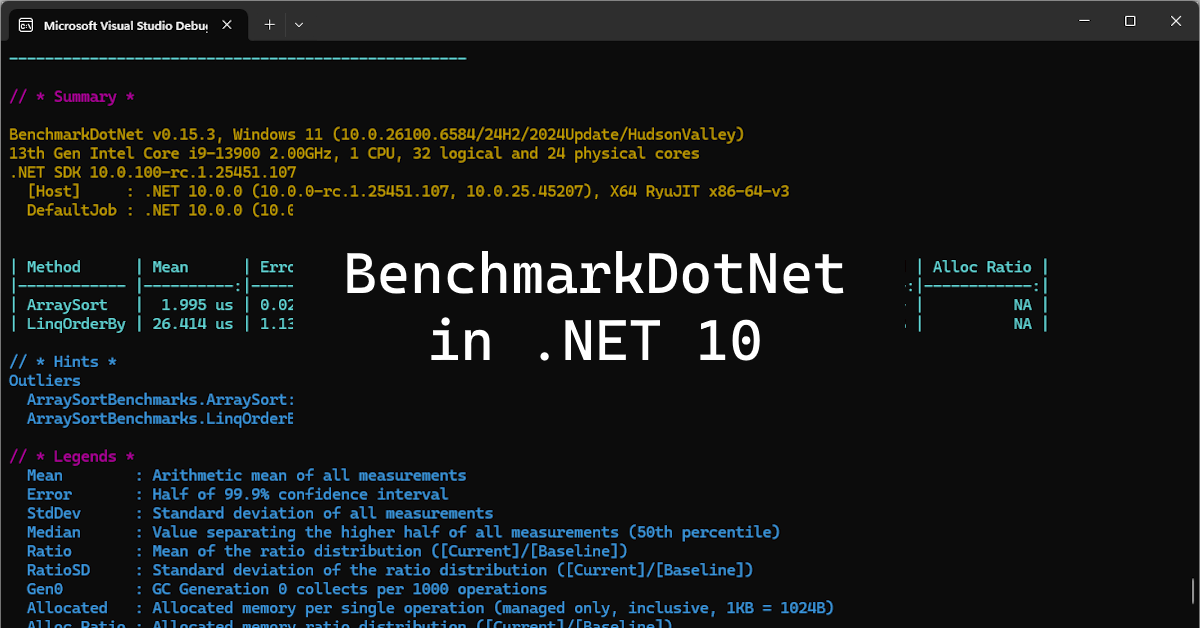
Benchmarking in .NET 10 with BenchmarkDotNet
It’s hard to remember a time when benchmarking was so simple! Gone are the days when inserting manual timestamps to output and using Windows’ built-in Performance Monitor (perfmon.msc) was a thing. In an age where cloud compute power comes at a cost, it’s never been more important to optimise and squeeze every last drop of efficiency from our code.
I’ve been using BenchmarkDotNet for a while now to run some numbers to see how performant my code is, as well as how well it scales. The tool was particularly useful recently when doing a side-by-side comparison in my Benchmarking System.Text.Json and Newtonsoft.Json post. I’ll run through some more examples of how to use the NuGet package below.
Project Setup: BenchmarkDotNet in .NET 10
Prerequisites
I’ll be using Visual Studio 2026 Insiders preview, along with .NET 10 RC1 to run the code today. But don’t worry if you have different versions or use another IDE – everything we’ll be looking at is backwards-compatible. You can download all the code from my Benchmarking with BenchmarkDotNet GitHub repo, or copy and paste the commands and code snippet below to start from scratch.
Create a .NET 10 Project with BenchmarkDotNet
Let’s start by creating the benchmarking project on your machine. Open your favourite console (e.g., CMD, PowerShell) and run the following commands:
# Create a new console app
dotnet new console -n BdnBenchmarking
# Switch to the new project directory
cd BdnBenchmarking
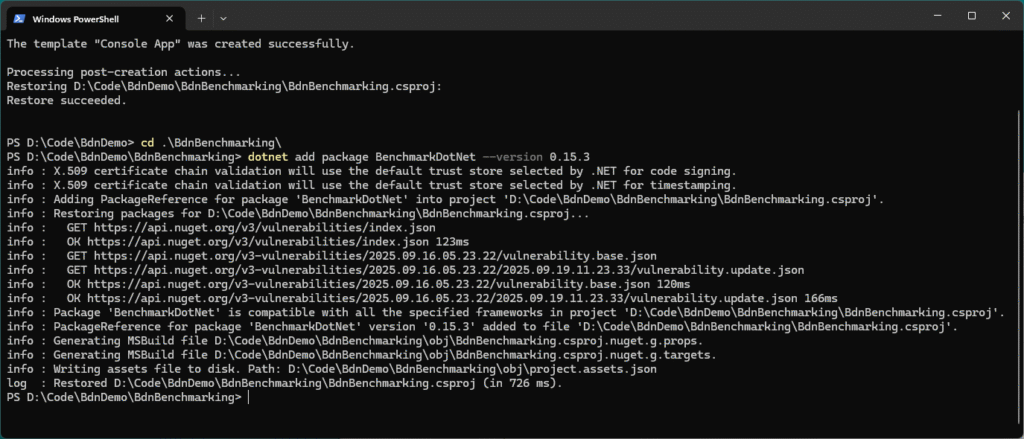
# Add the BenchmarkDotNet package (latest stable at the time of writing)
dotnet add package BenchmarkDotNet --version 0.15.3You’ll see the following in your terminal once you’ve run the commands successfully:
Run BenchmarkDotNet from Your IDE
Before we get started, here’s the test spec of the dev machine I’ve run these on:
BenchmarkDotNet v0.15.3, Windows 11 (10.0.26100.6584/24H2/2024Update/HudsonValley)
13th Gen Intel Core i9-13900 2.00GHz, 1 CPU, 32 logical and 24 physical cores
.NET SDK 10.0.100-rc.1.25451.107
  [Host]     : .NET 10.0.0 (10.0.0-rc.1.25451.107, 10.0.25.45207), X64 RyuJIT x86-64-v3
DefaultJob : .NET 10.0.0 (10.0.0-rc.1.25451.107, 10.0.25.45207), X64 RyuJIT x86-64-v3Open the project in your IDE (e.g., Visual Studio, Rider, etc) and replace the Program.cs with the following:
using BenchmarkDotNet.Configs;
using BenchmarkDotNet.Order;
using BenchmarkDotNet.Running;

public class Program
{
    public static void Main(string[] args)
    {
        var config = ManualConfig.Create(DefaultConfig.Instance).WithOrderer(new DefaultOrderer(SummaryOrderPolicy.FastestToSlowest));

        BenchmarkSwitcher.FromAssembly(typeof(Program).Assembly).Run(args, config);
    }
}Create a new folder called Benchmarks, which is where we’ll add each of the examples. Start by creating a class file called ArraySortBenchmarks.cs and pasting in the first bit of code we’ll benchmark:
namespace Benchmarks;

using BenchmarkDotNet.Attributes;

[MemoryDiagnoser]
public class ArraySortBenchmarks
{
    private int[] arr = new int[1000];

    [GlobalSetup]
    public void Setup()
    {
        var r = new Random(42);
        for (int i = 0; i < arr.Length; i++) arr[i] = r.Next();
    }

    [Benchmark(Baseline = true)]
    public void ArraySort() => Array.Sort(arr);

    [Benchmark]
    public void LinqOrderBy() => arr.OrderBy(x => x).ToArray();
}You should see the following:

Select Release from the Solution Configuration dropdown and click the Start Without Debugging:

Always run benchmarks in Release without the debugger attached – otherwise you’re just timing the debugger and JIT warmup, not the code you actually care about.
A console window will appear, where you’ll see the new test we just added at position zero. As we add more, they will also appear in the list. Let’s run the test by typing in #0 and pressing Enter:

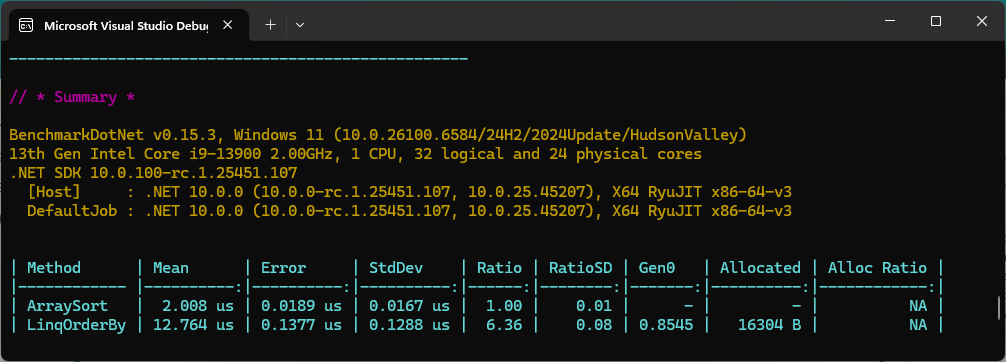
Benchmarking will begin and you’ll see the status of the tests in the console’s title bar. Once finished, the results will be shown in the console:
Understanding BenchmarkDotNet Columns and Metrics
Using the DefaultConfig.Instance means we get a default set of columns that output the measurements from the code runs. Briefly, here’s what they each describe:
- Method: The benchmarked method name (
ArraySort,LinqOrderBy). - Mean: Average execution time per operation. This is the number you usually compare.
- Error: Half of the 99% confidence interval. Tells you the precision of the mean.
- StdDev: Standard deviation, i.e. how much individual runs vary. Lower is more stable.
- Ratio: Relative speed compared to the baseline (here
ArraySort= 1.00).LinqOrderByat 6.36 means ~6x slower. - RatioSD: Variance of that ratio across runs.
- Gen0: Average number of Gen0 garbage collections per operation.
- Allocated: Bytes allocated per operation (
LinqOrderByis ~16 KB,ArraySortallocates nothing). - Alloc Ratio: Relative allocation compared to baseline. (Here “NA” since the baseline didn’t allocate at all.)
Read more about configuring columns in the BenchmarkDotNet documentation.
Benchmark Results and Exported Reports
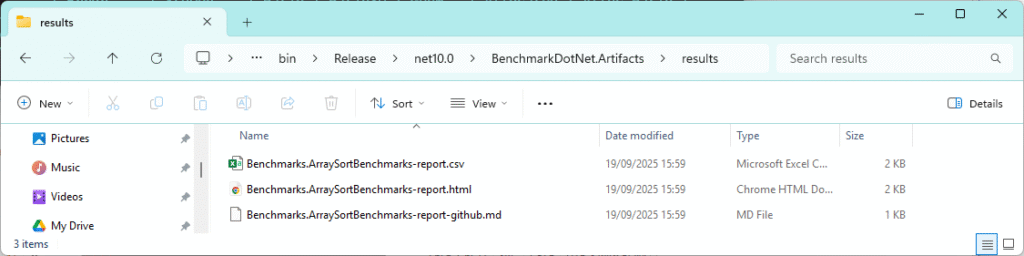
As we’re using the default configuration for BenchmarkDotNet, output will also be stored in the following location: BdnBenchmarking\bin\Release\net10.0\BenchmarkDotNet.Artifacts
The location may change depending on the .NET Framework version you’re using (i.e., it won’t always be “net10.0” in the path), but it will always live in the \bin\Release folder under your project.
Here, you can see everything from the console output, plus a results folder, which stores user-friendly representations of the benchmarking:
This is extremely handy if you want to use them for any other purpose. Here are some things I’ve found them useful for in the past:
- CSV: Feed into Excel/Power BI for graphs, or pipe into a CI pipeline to detect regressions over time.
- HTML: Great for dropping straight into your blogs or webpages, with styled reports that non-dev stakeholders can read without extra tooling.
- Markdown (.md): Paste straight into GitHub issues, pull requests, or wikis without touching formatting.
And that’s not even the whole lot – there’s JSON, R plots, XML, and more exporters are available if you want to wire benchmarks up to dashboards or data workflows. You’ll see new ones appear for each of the following examples we add. If you want to keep them, move them somewhere safe so that they don’t get removed accidentally.
Great – we have our first result! And you’ve almost certainly seen by now that ArraySort is the clear winner, averaging ~2 μs, while LinqOrderBy comes in at ~12.7 μs – over six times slower. That’s because Array.Sort is a tight, in-place algorithm implemented in unmanaged code. Linq.OrderBy builds a new sequence, allocates memory (16 KB here) and incurs delegate overhead.
In the next section, we’ll run through the rest of the benchmarks, which include some common bits of code you’ll see in use every day (and probably use all the time yourself). If you’d rather get your hands on the whole lot, grab the project from my Benchmarking with BenchmarkDotNet GitHub repo.
Running Your .NET 10 Benchmarks with BenchmarkDotNet
Have a guess before revealing the answers and running the benchmarks yourself – see how many you can get right. Some may surprise you…
Benchmark: DateTime.Now vs DateTime.UtcNow in .NET 10
Drop the following into a new file alongside the first and call it DateTimeNowVsUtcNowBenchmarks.cs and run the console app again, selecting #1:
namespace Benchmarks;
using BenchmarkDotNet.Attributes;

[MemoryDiagnoser]
public class DateTimeNowVsUtcNowBenchmarks
{
    [Benchmark(Baseline = true)]
    public DateTime Now() => DateTime.Now;

    [Benchmark]
    public DateTime UtcNow() => DateTime.UtcNow;
}DateTime.Now or UtcNow – which one is fastest? 👈🏻 Click to reveal
🏆 UtcNowUtcNow comes in at ~16 ns per call.Now drags at ~45 ns – roughly 3x slower.
The reason’s straightforward: UtcNow just reads the system clock. Now has to do that plus run time zone and daylight-saving conversion logic on every call. That extra layer shows up immediately in the numbers.
Neither allocates, so the only cost here is pure CPU. If you need raw timestamps in hot paths, prefer UtcNow and only convert once at the boundary where local time actually matters.
Benchmark: Dictionary vs ConcurrentDictionary Performance
Add DictionaryVsConcurrentBenchmarks.cs to the Benchmarks folder:
namespace Benchmarks;

using System.Collections.Concurrent;
using BenchmarkDotNet.Attributes;

[MemoryDiagnoser]
public class DictionaryVsConcurrentBenchmarks
{
    private Dictionary<int, int> _dict = null!;
    private ConcurrentDictionary<int, int> _cdict = null!;
    private int _nextKey;

    private const int Capacity = 4_096;
    private const int ExistingKey = 123456;

    [IterationSetup]
    public void IterationSetup()
    {
        _dict = new Dictionary<int, int>(Capacity);
        _cdict = new ConcurrentDictionary<int, int>(concurrencyLevel: Environment.ProcessorCount, capacity: Capacity);

        _dict[ExistingKey] = 42;
        _cdict[ExistingKey] = 42;

        _nextKey = 0;
    }

    [Benchmark(Baseline = true)]
    public int DictLookup() => _dict[ExistingKey];

    [Benchmark]
    public int ConcurrentLookup() => _cdict[ExistingKey];

    [Benchmark]
    public void DictInsert() => _dict[_nextKey++] = 1; // true "insert" into a pre-sized dict

    [Benchmark]
    public void ConcurrentTryAdd() => _cdict.TryAdd(_nextKey++, 1);
}Dictionary vs ConcurrentDictionary – which one wins? 👈🏻 Click to reveal
🏆For inserts and lookups, Dictionary is the clear winner in single-threaded code:
Insert: DictInsert lands at ~80 ns, while ConcurrentTryAdd takes ~732 ns – about 9x slower and with small extra allocations (40 B).
Lookup: Plain Dictionary is still cheaper (~155 ns) than ConcurrentDictionary (~273 ns).
This is because Dictionary is optimised for raw speed with no concurrency guarantees. ConcurrentDictionary wraps every access in thread-safe mechanics (locks/volatiles and coordination), which costs CPU cycles even if you don’t actually have contention.
Takeaway: Use Dictionary whenever thread safety isn’t a requirement and use ConcurrentDictionary only when multiple writers are unavoidable because the safety net isn’t free.
Benchmark: String Equality in C# (.NET 10)
Add StringComparisonBenchmarks.cs:
namespace Benchmarks;
using BenchmarkDotNet.Attributes;

[MemoryDiagnoser]
public class StringComparisonBenchmarks
{
    private string a = "SitecoreRocks";
    private string b = "sitecorerocks";

    [Benchmark(Baseline = true)]
    public bool OperatorEq() => a == b;

    [Benchmark]
    public bool EqualsMethod() => a.Equals(b);

    [Benchmark]
    public bool OrdinalIgnoreCase() => string.Equals(a, b, StringComparison.OrdinalIgnoreCase);
}
Operator vs Equals vs OrdinalIgnoreCase – which one wins? 👈🏻 Click to reveal
🏆 == operator
== operator is fastest at ~1.1 ns. It’s a direct inline call to string.Equals with ordinal semantics..Equals (instance method) is slower at ~2.5 ns, still trivial but an extra indirection.StringComparison.OrdinalIgnoreCase is the heavyweight at ~25 ns, over 20x slower – because case-insensitive comparison has to normalise characters and account for Unicode rules.
None of these allocate; it’s all CPU. The lesson: use == or .Equals for hot-path equality when case sensitivity is acceptable. Only reach for OrdinalIgnoreCase when correctness around case really matters – the performance tax is obvious.
Benchmark: String Interpolation vs string.Format
Add StringInterpolationBenchmarks.cs:
namespace Benchmarks;
using BenchmarkDotNet.Attributes;

[MemoryDiagnoser]
public class StringInterpolationBenchmarks
{
    private int a=1, b=2, c=3;

    [Benchmark(Baseline = true)]
    public string Interpolation() => $"{a}-{b}-{c}";

    [Benchmark]
    public string Format() => string.Format("{0}-{1}-{2}", a,b,c);
}
String Interpolation or string.Format – which one wins? 👈🏻 Click to reveal
🏆 Interpolation
Interpolation ($"{a}-{b}-{c}") wins at ~12 ns, allocating just 32 B.string.Format lags at ~36 ns, with a much heavier 104 B allocation. That’s a 3x slower path with over 3x the memory churn.
Why? Interpolation is compiler sugar – the C# compiler rewrites it into efficient concatenation, in-lining most of the work. string.Format has to parse the format string, box arguments when necessary, and run through a more general formatting pipeline.
The practical advice: prefer string interpolation. It’s faster, allocates less, and reads cleaner. Save string.Format for cases where you genuinely need dynamic format strings.
Further BenchmarkDotNet Examples in .NET 10
The accompanying Benchmarking with BenchmarkDotNet GitHub repo contains focused, copy-and-paste benchmarks beyond the five I demo in the post:
ArraySortvs LINQOrderByDateTime.NowvsUtcNowDictionaryvsConcurrentDictionary(lookups and writes)queryvs method LINQ syntaxRandomvsRandomNumberGenerator- Source-generated
Regexexample spanslicing vsSubstringstringequality (==,.Equals,OrdinalIgnoreCase)stringinterpolation vsstring.Format- …and a
switchvsDictionarylookup benchmark
Every class uses [MemoryDiagnoser], runs on .NET 10 RC1, and exports Markdown/CSV/JSON so you can drop results straight into GitHub, a blog, or a dashboard, if you want to.
Advanced: Regression Testing with BenchmarkDotNet Configs
BenchmarkDotNet doesn’t stop at one-off runs. The config API lets you customise everything from columns (latency percentiles, allocation ratios), to environments (different runtimes, GC modes, server vs workstation), and even run the same benchmark across multiple frameworks.
That makes it a perfect fit for regression testing. You can easily wire up CSV or JSON exporters in CI, compare today’s numbers against a baseline, and catch performance hits before they reach production. It’s so powerful. With just a couple of lines of config you can test .NET 8 vs .NET 10, server vs workstation GC, or AVX2 vs AVX-512 codegen, all from the same benchmark class.
Benchmarking Multiple Frameworks & GC Modes
Conveniently, you don’t need to multi-target the project in the usual way (i.e., using <TargetFrameworks> in the .csproj) because BenchmarkDotNet will build per runtime if the SDKs are installed. Add jobs via attributes (for frameworks) and config (for GC), then let the suite run all combinations. Here’s an example of a config using different GC modes and .NET runtimes:
namespace Configs;

using BenchmarkDotNet.Configs;
using BenchmarkDotNet.Environments;
using BenchmarkDotNet.Jobs;

public sealed class BlogConfig : ManualConfig
{
    public BlogConfig()
    {
        // .NET 9
        AddJob(Job.Default.WithId("net9-ServerGC")
            .WithRuntime(CoreRuntime.Core90)
            .WithGcServer(true));
        AddJob(Job.Default.WithId("net9-Workstation")
            .WithRuntime(CoreRuntime.Core90)
            .WithGcServer(false));

        // .NET 10
        AddJob(Job.Default.WithId("net10-ServerGC")
            .WithRuntime(CoreRuntime.Core10_0)
            .WithGcServer(true));
        AddJob(Job.Default.WithId("net10-Workstation")
            .WithRuntime(CoreRuntime.Core10_0)
            .WithGcServer(false));
    }
}It’s applied by decorating the benchmark classes with the Config attribute:
[Config(typeof(BlogConfig))]
public class YourBenchmarks
{ ... }All tests will now run with the specified frameworks and GC mode.
Real World Benchmarking
With .NET 10 now available shipping brand new System.Text.Json features, do we still need Newtonsoft.Json? Read a side-by-side comparison using BenchmarkDotNet: Benchmarking System.Text.Json vs Newtonsoft.Json in .NET 10: Which Wins in 2025?
Final Thoughts
BenchmarkDotNet makes benchmarking so easy – just drop in a class, add a few [Benchmark] methods, and you’re gifted real numbers with confidence intervals, ratios, and allocation data. It definitely beats the old stopwatch. The examples here are simple, but the same approach scales to your real-world code. So next time you’re wondering if a change you’re about to make could impact the longevity of your code, write a benchmark to find out for sure.
[…] to determine which comes out on top. If you’re new to BenchmarkDotNet, check out my post on BenchmarkDotNet in .NET 10: Step-by-Step with 5 Real C# Benchmarks, which guides you through a really simple […]