
Table of Contents
If you’re looking specifically at troubleshooting API and network problems in Azure App Services, check out my previous post.
Introduction to Azure Kudu Diagnostics
If you run workloads on Azure App Services and need practical, repeatable steps to diagnose unresponsive sites, high CPU usage, sudden memory surges or stalled threads, this post is for you!
Diagnosing problems in the cloud is often harder than it should be. Metrics usually tell only part of the story, and even detailed application logging often fails to expose issues that only appear under load. But when a site is spiking CPU, leaking memory, hanging on requests or restarting for no apparent reason, you need more than charts and logfiles.
Azure Kudu Diagnostics exposes the internals of your App Service worker process in a way that standard logs and metrics simply can’t. For diagnosing CPU spikes, memory leaks, memory bombs, thread pool starvation or random worker recycles, Kudu is the most direct route to understanding exactly what your .NET application is doing under load.
This post uses a demo .NET 10 app that I built specifically for demonstrating diagnostics. We’ll walk through the relevant bits, but if you want to go hands-on and deploy it yourself, everything’s available in my Azure Kudu Diagnostics Demo GitHub repository.
The Demo Application
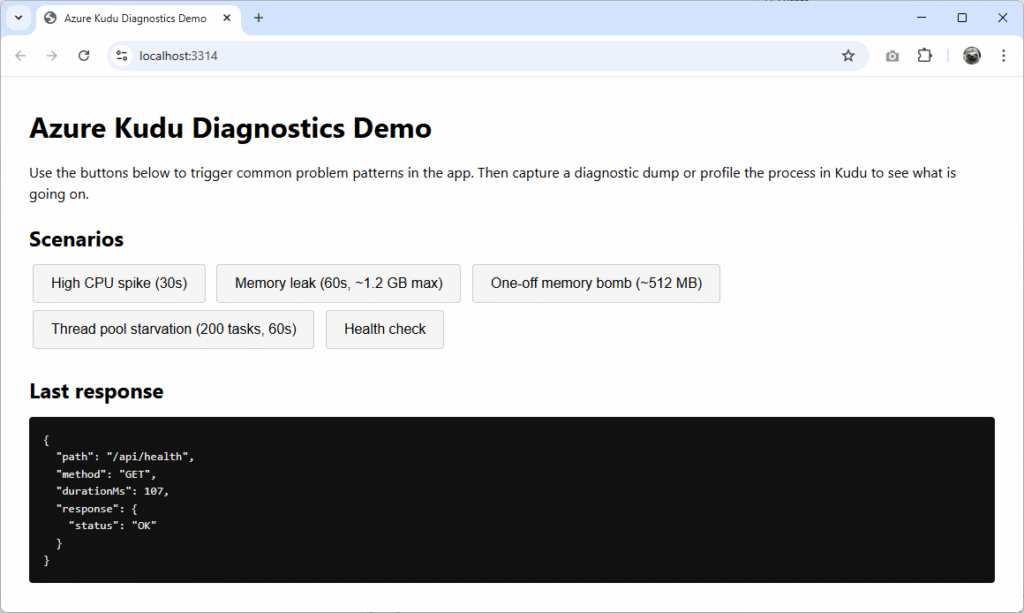
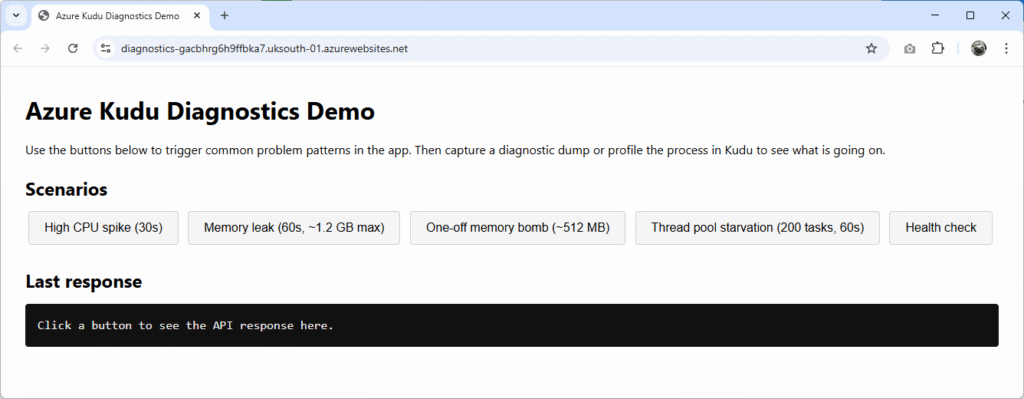
You can find the Azure Diagnostics Demo application on GitHub. It’s a minimal .NET 10 app with a static front end that exposes a set of diagnostic buttons that will artificially trigger:
- High CPU spike (30s)
- Memory leak (30s)
- One-off memory bomb (~512 MB)
- Thread pool starvation (60s, 200 tasks)
- Health check (indicating responsiveness by ping time)
Each of the buttons correspond to an API endpoint. The back end lives in Program.cs and the behaviour is implemented in the ProblemSimulator.cs class. Here is it running locally:
Deploying to an Azure App Service
To run it yourself, create a 64-bit Azure App Service and deploy it there using your chosen method. I used Visual Studio’s integrated deployment method for this small demo, which is super speedy. You may run into problems if your App Service uses a 32-bit worker or use a low tier, such as profiling and dump generation silently failing.
Important: Ensure that your Azure App Service is scaled to at least Premium v4 P1V4 (or equivalent), otherwise dump files may not generate correctly, if at all.
Step 1: Create Azure App Service
Open the Azure Marketplace in the Azure Portal and create a new Web App with the following settings:
- Publish: Code
- Operating System: Windows
- Runtime Stack: .NET 10 (LTS)
- Pricing Plan: Premium V4 P0V4 (4 GB memory, 1 vCPU)
Once you’re happy with the name and resource group, click Review + create to confirm all the details, and finally choosing Create to deploy the App Service.
Step 2: Change to a 64-bit Worker
Once your new App Service is ready, view it and select Settings > Configuration (preview) from the left-hand menu. Change the Platform setting at the top of the pane to 64-bit and apply the changes.
Step 3: Preparing to Publish
There are many ways you can deploy code to an Azure App Service, so use whichever feels most convenient or comfortable for you. For the demo, and to allow us to publish quickly if we make any tweaks to the code, we’re going to use Visual Studio’s built-in connector.
If you haven’t already, clone the Azure Diagnostics Demo repo and open it in Visual Studio. Right-click the KuduDiagnosticsDemo project and select Publish.
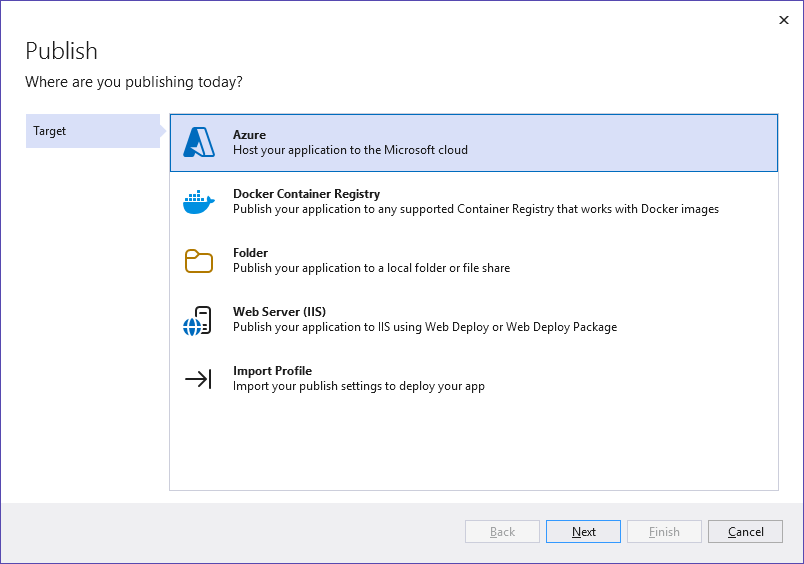
In the new window, choose Azure and click Next:
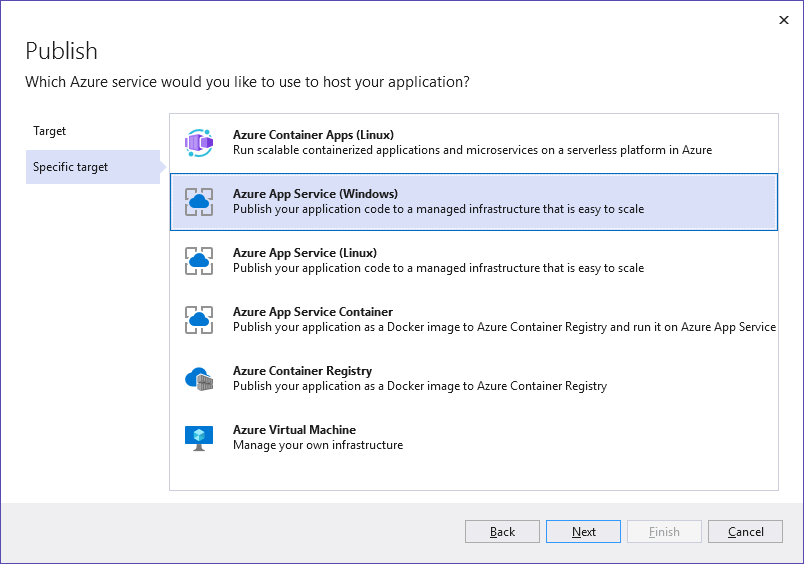
Select Azure App Service (Windows) and click Next:
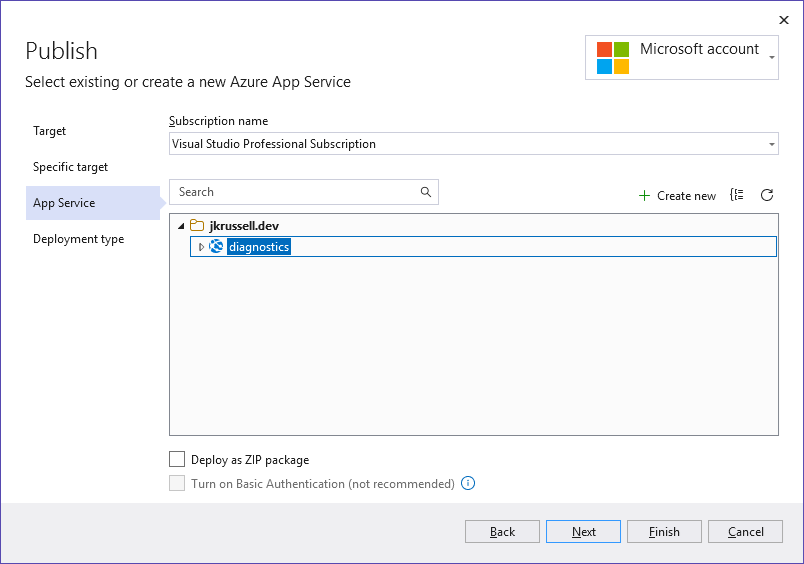
Choose your newly-created App Service from the list of available resources in your Azure subscription, and go Next again:
Finally, generate a .pubxml file for the project to save all of these settings and click Finish:
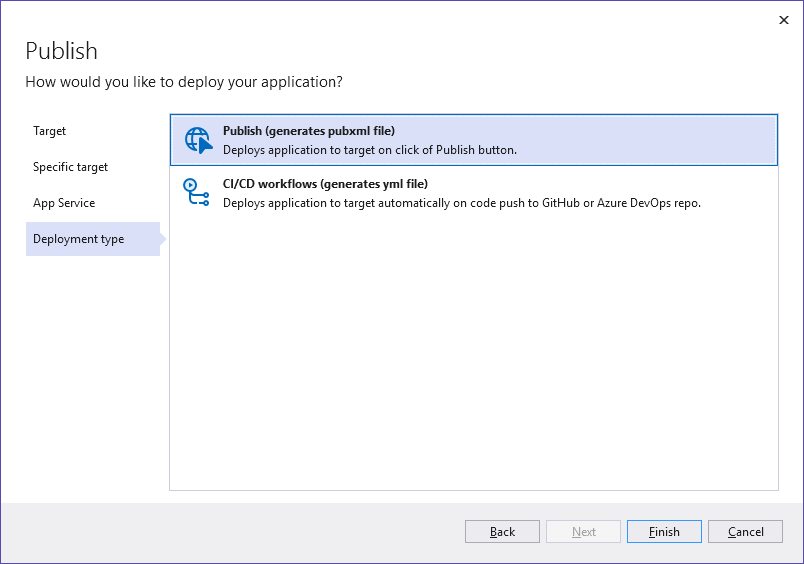
You’ll see the following confirmation screen for the publish profile, which will be saved in the PublishProfiles folder of the project:
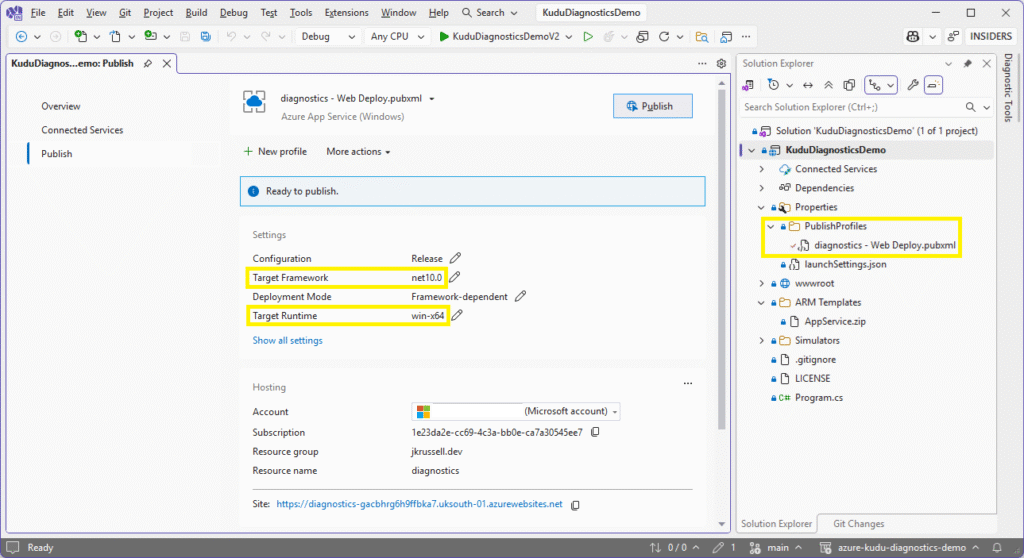
The Target Framework and Target Runtime settings have been automatically pulled down from the Azure App Service.
Step 4: Publish the Kudu Diagnostics Demo Project
Publishing the demo project to the newly-created App Service is easy from now on. Click the Publish button to package the code and deploy securely to Azure:
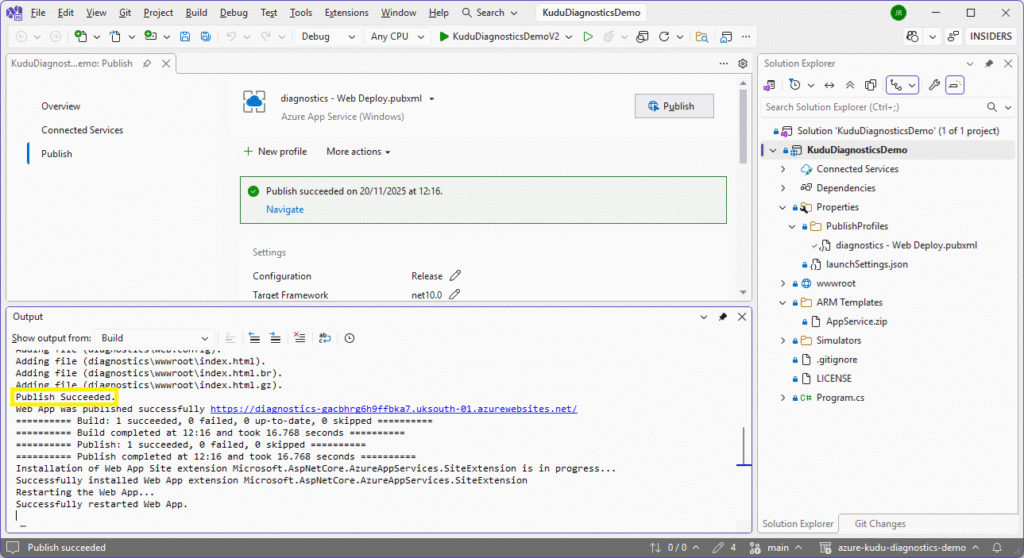
Because the publish profile is now saved, any time we select to Publish this project, it will be loaded automatically and one click will push the changes – which is great for projects like this where we might want to modify application code quickly to test different load scenarios.
Diagnosing the Problem Scenarios
Navigate to the App Service URL in your browser to see the following artificially-made problem scenarios and identify how Kudu might help us make a diagnosis:
1. High CPU Spike
Let’s start by looking at a really common problem: high CPU usage. The following code kicks off a synthetic CPU spike for 30 seconds, spinning up one worker task per logical processor – each running a tight inner loop of MathF.Sqrt calculations:
app.MapPost("/api/high-cpu", () =>
{
    var duration = TimeSpan.FromSeconds(30);
    var end = DateTime.UtcNow + duration;
    var workers = Environment.ProcessorCount;

    var tasks = new List<Task>(workers);

    for (var i = 0; i < workers; i++)
    {
        tasks.Add(Task.Run(() =>
        {
            while (DateTime.UtcNow < end)
            {
                for (var j = 0; j < 10_000_000; j++)
                {
                    _ = MathF.Sqrt(j * 123.456f);
                }
            }
        }));
    }

    Task.WaitAll(tasks.ToArray());

    return Results.Ok(new
    {
        message = "High CPU spike completed.",
        workers,
        durationSeconds = duration.TotalSeconds
    });
});Click the High CPU spike button in the UI. The following message will be displayed in the Last response pane once it completes:
{
  "path": "/api/high-cpu",
  "method": "POST",
  "durationMs": 30161,
  "response": {
    "message": "High CPU spike completed.",
    "workers": 1,
    "durationSeconds": 30
  }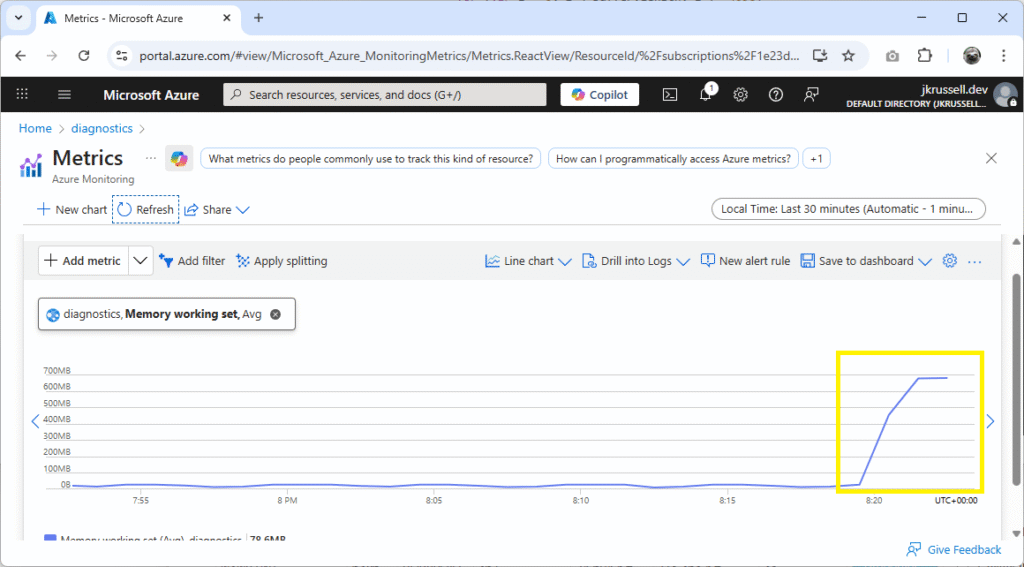
}Verify CPU Spike Metrics
Navigate to the Metrics section of the App Service, where a CPU Time spike will be clearly visible:
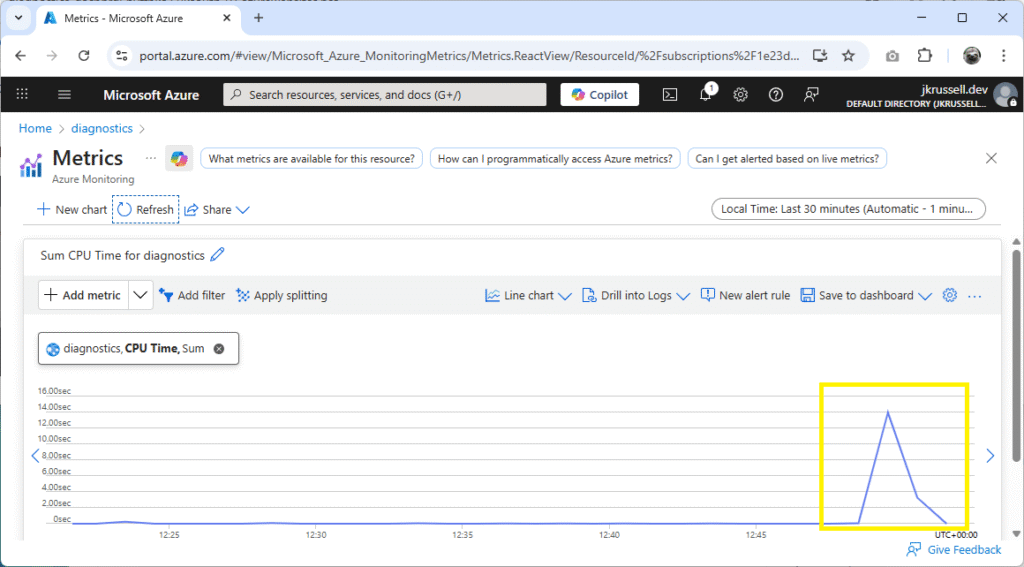
Now we know that the method call produces an undesirable fluctuation in processor usage, run it again, but this time making sure to profile the worker process beforehand to capture what’s going on.
To do this, open the Kudu console by selecting Development Tools > Advanced Tools > Go from the left-hand menu of the App Service, or navigate directly to https://<your-app-service-name>.scm.azurewebsites.net/ in your browser.
Profiling in Kudu
After the Kudu console loads, click Process explorer:

Using the simple App Service we created, there will be two w3wp.exe worker processors: one labelled with the blue tag scm, which is the Kudu instance we’re in, and the other running the demo code we just ran the CPU spike on. Click Start Profiling on the second worker:
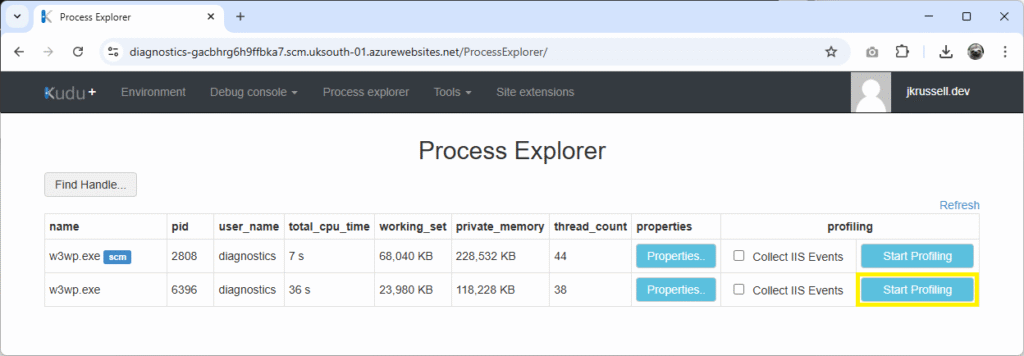
It’s not necessary to Collect IIS Events in this case, as this will add a huge amount of IIS-generated information and bloat – so leave that unchecked.
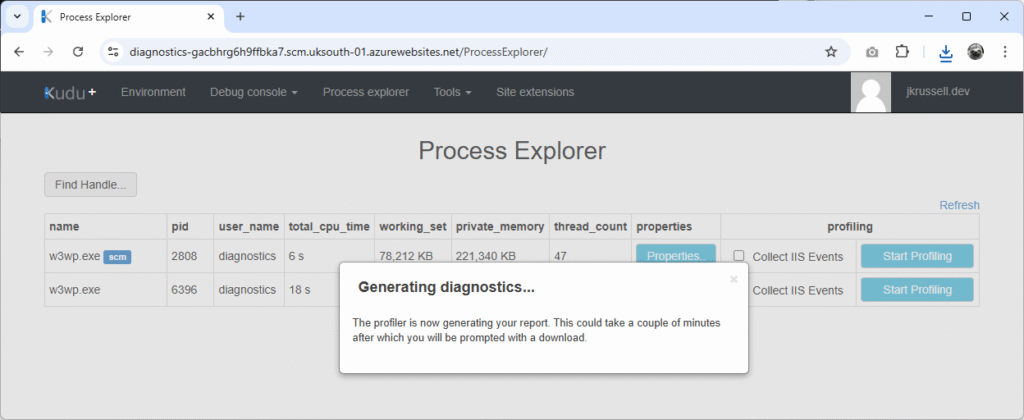
Now, burden the processor by again clicking the High CPU spike button in the UI. Once the call completes after 30 seconds, Stop Profiling in Kudu to generate the .diagsession file:
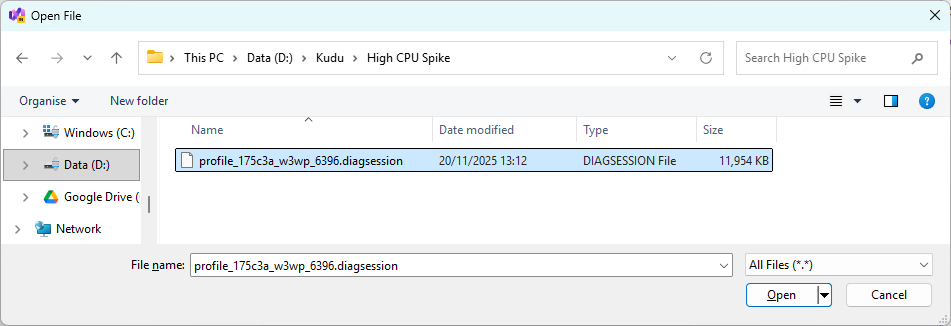
A save dialogue will appear with a filename similar to profile_175c3a_w3wp_6396.diagsession. The components of the name include:
175c3a: the first six characters of the App Service Instance ID, as viewed on the Environment tab.6396: the Process ID (PID) of the runningw3wp.exe, seen in the Process Explorer tab.
Analyse the .diagsession in Visual Studio
Switch to the Visual Studio instance containing the Kudu Diagnostics Demo project, and choose File > Open > File. Select the .diagsession profile we just saved:
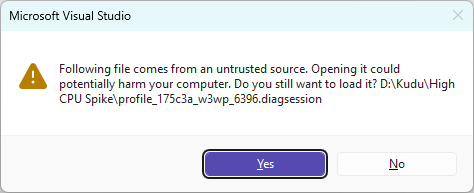
The following message will prompt to open the file “from an untrusted source”. It’s safe to continue, as we know exactly where this has come from, so select Yes:
Once the .diagsession file has loaded, you will see a series of sharp CPU spikes in the timeline. Click the Program.Main.AnonymousMethod__5() at the end of the hot path:
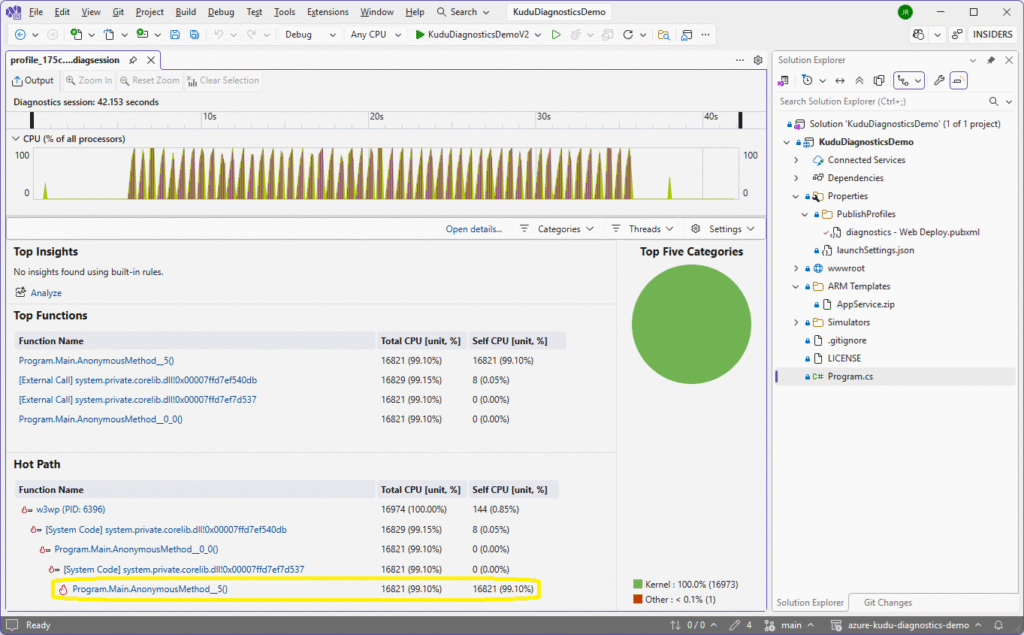
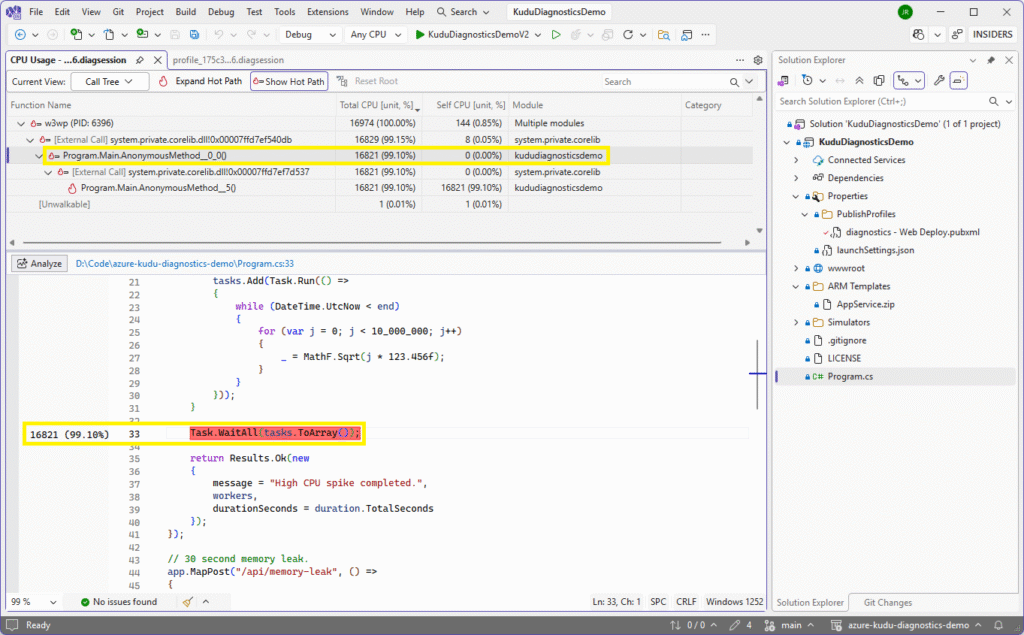
The CPU Usage tab will open in the Call Tree view and, because we have the project locally and symbols are loaded, the exact method causing the high 99.10% CPU load is pinpointed and the thread stacks inside the problematic MathF calls highlighted in red:
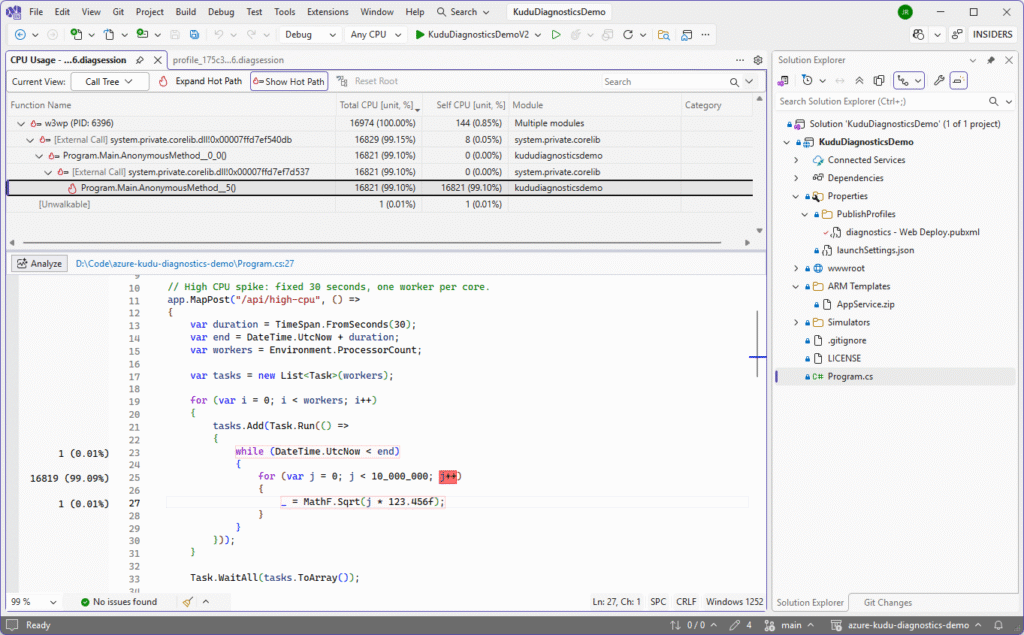
The allocated CPU time is marked against the suspicious lines of code in the left-hand column. Navigating further up the tree list reveals calling methods, which is particularly useful if the problem code is called from numerous places:
CPU Usage Views in Visual Studio
There are other CPU Usage views that may be useful and are each available in the dropdown list in the top right of the pane:
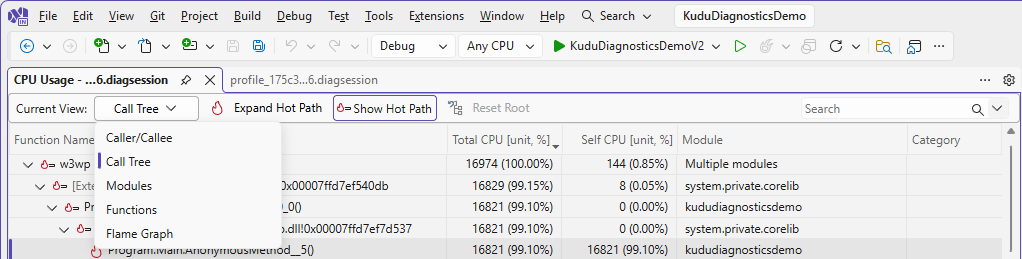
The Caller/Callee view shows how a hot function fits into its surrounding call chain. In an isolated profiling scenario it highlights which entry points lead into the heavy work and what that work calls internally. It’s useful in a full website for seeing whether a slow method is triggered by one route or many, and whether the real cost sits in that method or deeper in its dependencies.
Modules groups CPU usage by assembly, giving a quick overview of which parts of the system are doing the most work. In a full site it reveals whether the bottleneck lies in application logic, the .NET runtime, or third party libraries.
Functions lists individual methods by their CPU cost, making identifying hotspots really simple. In isolated testing it quickly identifies the intentional problem method and shows whether the time is spent inside it or in calls it makes. In a full website it often uncovers unexpected offenders like repeated string handling, overactive logging or inefficient data access.
Lastly, Flame Graph visualises CPU usage across entire call stacks, making dominant workloads stand out. In a repro like ours this usually produces one clear tower of activity that illustrates the issue neatly. But in a larger site it helps highlight patterns such as a single controller action or background task consuming most of the CPU, and makes it easy to spot deep or complex load-heavy call paths
These are all just different ways of slicing the same profiling sample data so that you can answer slightly different questions.
The Importance of Debug Symbols
For Visual Studio to let you click directly into your code from a .dmp or .diagsession, the exact PDB (.pdb) files that were produced alongside the deployed build must be available. If you open the diagnostics on a different machine, or you have rebuilt the project, the file hashes will no longer match and VS will refuse to load them. SourceLink can help here by telling Visual Studio exactly which Git commit the DLL came from, but it still needs to fetch or reconstruct matching symbols. If your symbols are not loading, it is almost always because the PDBs do not match the binaries from the running App Service.
Using symbols brings many benefits of speed, efficiency, and being able to directly step into the codebase. Working with and managing them is a whole post in itself, but check out this page on Microsoft Learn in the meantime: Visual Studio Profiling: Optimizing Profiler Settings.
2. Memory Leak
A memory leak happens when your application keeps references to objects that it no longer needs. The Garbage Collector (GC) can only collect memory that is no longer reachable from a root, so if you hold on to lists, static fields, or anything long lived, the memory stays alive even though the work that originally used it is long finished. Some common leak patterns include static collections that never shrink, event handlers that are never unsubscribed, misuse of HttpClient (a big one!), and inadvertent caching of large objects. In a long-running process like an App Service, even small leaks become significant over time.
Trigger a Memory Leak
The leak is implemented in the ProblemSimulator.cs class and starts an asynchronous, timed memory leak that repeatedly allocates 10 MB chunks until the duration expires or a maximum cap is reached:
public static long StartTimedLeak(TimeSpan duration)
{
	lock (LeakLock)
	{
		// If a leak is already running, just report the current total.
		if (_leakTask is { IsCompleted: false })
		{
			return Interlocked.Read(ref _approxTotalMb);
		}

		_leakTask = Task.Run(async () =>
		{
			var end = DateTime.UtcNow + duration;

			while (DateTime.UtcNow < end)
			{
				// Stop early if we have already leaked a lot.
				if (Interlocked.Read(ref _approxTotalMb) >= LeakMaxMb)
				{
					break;
				}

				// Allocate a 10 MB block and touch every page so it is committed.
				var buffer = new byte[LeakChunkMb * 1024 * 1024];
				for (var i = 0; i < buffer.Length; i += 4096)
				{
					buffer[i] = 1;
				}

				lock (LeakStore)
				{
					LeakStore.Add(buffer);
				}

				Interlocked.Add(ref _approxTotalMb, LeakChunkMb);

				await Task.Delay(LeakDelayMs);
			}
		});

		return Interlocked.Read(ref _approxTotalMb);
	}
}Each chunk is actively paged in by touching every 4,096 byte page, making sure it becomes committed to physical memory rather than staying in virtual. All allocated blocks are stored in a shared list so they can’t be collected by the GC, while an interlocked counter tracks the total leaked MBs.
This time, because the tasks are spun up asynchronously, the API response returns immediately:
{
  "path": "/api/memory-leak",
  "method": "POST",
  "durationMs": 28,
  "response": {
    "message": "Started 30 second memory leak.",
    "durationSeconds": 30,
    "approxTotalAllocatedMb": 0
  }
}This time, the metrics show a sustained peak in the App Service’s memory working set:
You’ll also see the working_set memory in Kudu rise incrementally, too:
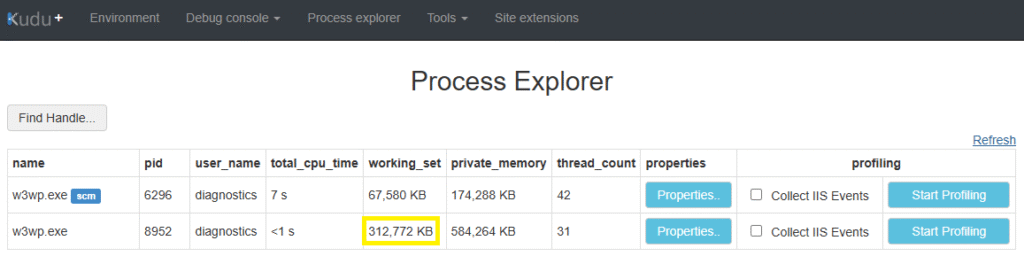
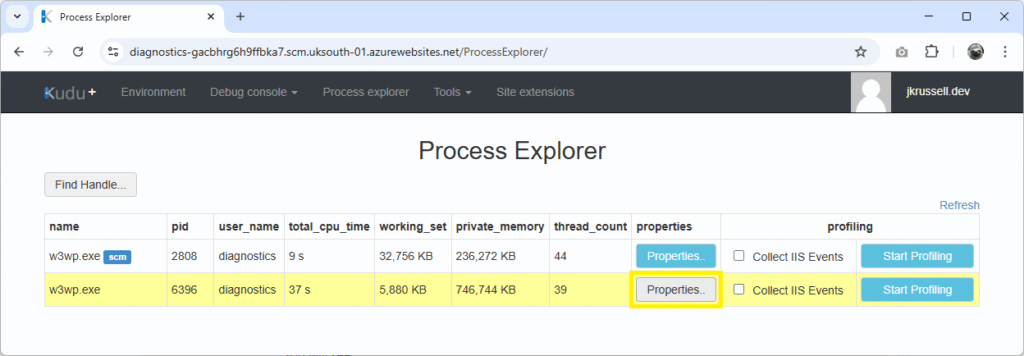
Download a Memory Dump
This time, instead of profiling the worker process, we’re going to create a memory dump. Trigger the memory leak again and wait until the memory use peaks at around the same level as before, then click Properties in the Kudu console on the website’s w3wp.exe:
Scroll down the pane and click Download memory dump:
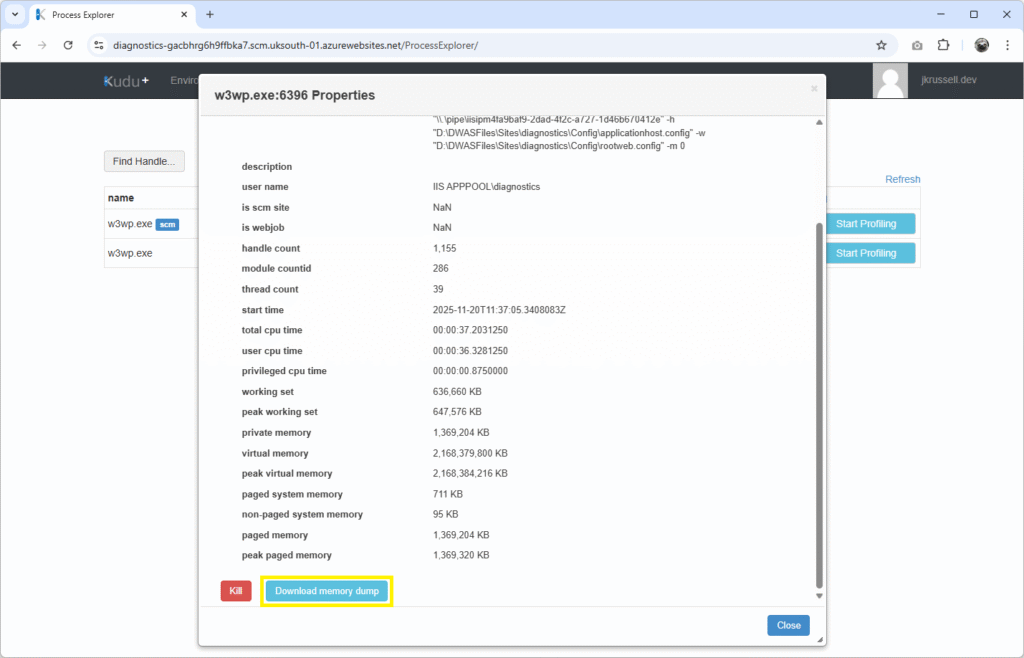
Creating the dump can take a minute or two, so don’t worry if the request appears long. The file should eventually be served with a name similar to w3wp-175c3a-11-20-20-32-34.dmp. This again contains the first six letters of the Instance ID (175c3a) and a timestamp of the date and time it was created.
Visual Studio .dmp Analysis
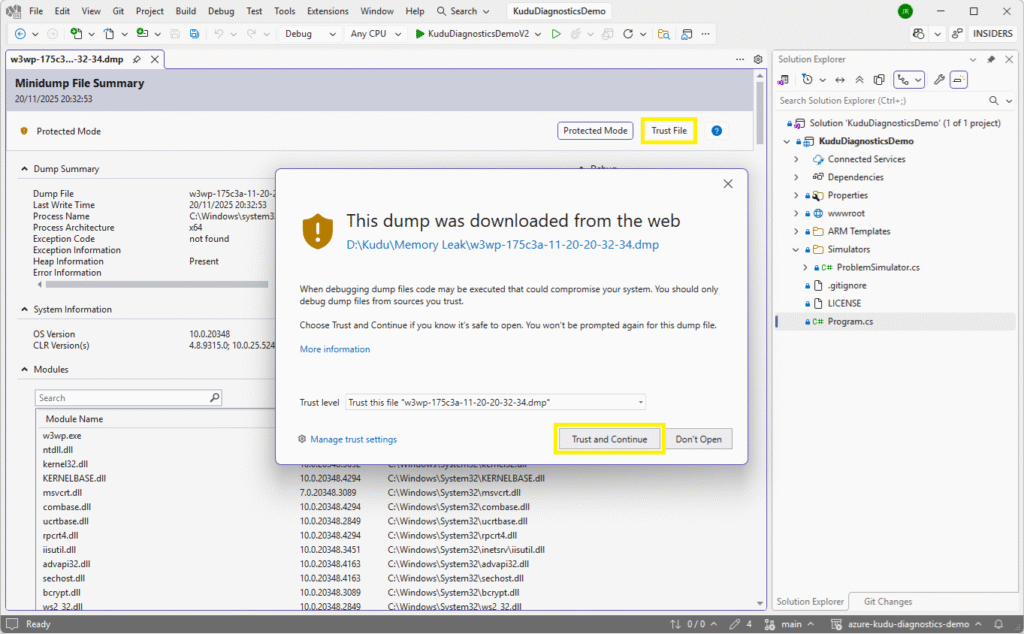
Open the newly-created .dmp file in Visual Studio using File > Open > File. Before you can continue with the analysis, click the Trust File button towards the top of the newly-presented pane, followed by Trust and Continue:
Next, click Debug Managed Memory from the Debug menu on the right:

After the debug session has started, ensure that the demo app’s binaries were loaded by selecting menu item Debug > Windows > Modules:
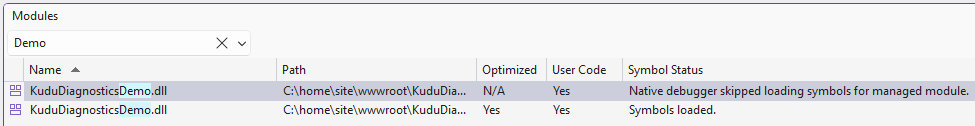
What we need to confirm is that our application code was loaded on the App Service and that local symbols have been loaded so that we can dynamically explore the code from the debug interface.
In the Managed Memory pane, order by Inclusive Size (Bytes) descending. This lets us see what’s coming out on top in terms of memory allocation. Here, it’s Byte[]:
![Managed Memory view highlighting a large set of Byte[] objects dominating the heap, showing over 800 MB of byte array allocations during analysis of the captured memory dump.](https://jkrussell.dev/wp-content/uploads/2025/11/image-50-1024x456.png)
Double click to drill down into Instances of Byte[], where more details such as the instance’s memory address, value, and size are displayed. Double clicking one of those instances reveals the lower Paths To Root pane, which points directly back to the relevant code in the demo application:
![Instances view for Byte[] in Visual Studio showing individual 10 MB array allocations, with the Paths To Root panel highlighting that these objects are held alive by the static ProblemSimulator.LeakStore list.](https://jkrussell.dev/wp-content/uploads/2025/11/image-51-1024x483.png)
With this new information, in a real-world scenario, you can explore in more details what might be going wrong in your custom code that triggered the memory leak.
Real leaks can easily hide in innocent looking code. Some examples are:
- Static lists storing objects for quick lookup but never removing old entries.
- Background jobs keeping tasks alive for longer than intended.
- In-memory caching of large JSON payloads or images with no expiry.
- Retention of DI scoped services stored in longer-lived objects.
There’s a common theme with all of these: something that should have been deallocated and collected by the GC continues to be referenced somewhere. This is why memory dump analysis is so valuable – it shows exactly what object graph is preventing the GC from doing its job.
3. Memory Bomb
A memory bomb is what happens when something in your application allocates a huge amount of memory in one hit. There’s no slow build-up and no gradual creep. One request or one code path suddenly decides it needs hundreds of megabytes, and the process takes a sharp upwards jump in private memory. It’s very different to the slow trickle of a memory leak in that a memory bomb is immediate and impactful. On a small or memory constrained machine like an App Service, just one memory bomb can be enough to push the worker into a recycle or trigger an OutOfMemoryException.
You might see this when code loads entire files into memory, reads massive JSON payloads in one go, or constructs large in-memory structures without any batching or streaming. Common scenarios are image processing, reporting jobs, and large data ingestion routines. I recently wrote about Streaming Massive Data with IAsyncEnumerable – just one option available in .NET aimed at avoiding these kinds of problems.
Drop a Memory Bomb
One-off memory allocations, or “memory bombs”, look a little different when debugging. Here’s the one from ProblemSimulator.cs, which uses ~512 MB in one go:
public static long AllocateMemoryBomb()
{
	// About 512 MB total, but do NOT hold on to it.
	const int totalMb = 512;
	var remaining = totalMb;

	// Local list only, goes out of scope when the request finishes.
	var local = new List<byte[]>();

	while (remaining > 0)
	{
		var chunkMb = Math.Min(remaining, 64); // 64 MB chunks
		var buffer = new byte[chunkMb * 1024 * 1024];

		// Touch each page so the memory is committed.
		for (var i = 0; i < buffer.Length; i += 4096)
		{
			buffer[i] = 1;
		}

		local.Add(buffer);
		remaining -= chunkMb;
	}

	// Report how much we just allocated, but do not store it anywhere.
	return totalMb;
}Use the memory bomb button in the UI to call the API endpoint.
Inspect the Memory Dump
Download another full dump, and open it in Visual Studio as before. Notice now, when sorting by Size (Bytes) or Inclusive Size (Bytes), there appears to be missing allocations for around ~500 MB.
It hasn’t disappeared, but is just hidden because it is no longer active. When Visual Studio talks about active objects, it means ones which are still reachable from a GC root at the moment the dump was taken. Dead objects are those that are no longer referenced by anything but haven’t yet been collected – but are flagged for imminent collection.
In this example, the huge byte arrays were only stored in a local list inside the request. As soon as it finished, the list went out of scope and the arrays had no references left – so they became dead objects. The dump will only show them when you tick Show dead objects (here, displayed along with a yellow warning triangle):
![Managed Memory view with “Show dead objects” enabled, revealing a large amount of unrooted Byte[] allocations from the memory bomb scenario still present on the heap even though they are no longer referenced by the application.](https://jkrussell.dev/wp-content/uploads/2025/11/image-53-1024x451.png)
As dead objects have no path back to code, we can’t simply view them in the Path To Code pane like before. Once the request finished and the local List<byte[]> in AllocateMemoryBomb went out of scope, there was no root anymore.
When looking at the leak endpoint in the previous example, objects stayed static in LeakStore, which is why we were able to directly link them back to the demo code. This time, though, objects were only held in a local list, which died when the request completed. The dump file is simply showing them as “dead but not yet collected”. It’s expected and makes sense when you understand that those arrays have already been deallocated from a reference point of view.
Memory Leaks vs Memory Bombs
Memory leaks creep. Memory bombs explode! One slowly pushes your working set higher over hours or days, eventually causing a slew of alerts and eventually a recycle. The other jumps your memory usage sharply in a single request. Kudu makes this distinction obvious: leaks appear as thousands of rooted objects, bombs appear as huge dead objects waiting for the next GC.
Working set shows the memory currently mapped into the process’ physical pages, whereas private memory shows memory exclusively owned by the process. Both are relevant, but private memory is often the more accurate indicator of leak severity.
4. Thread Pool Starvation
Thread pool starvation is what happens when an application runs out of available worker threads in the .NET ThreadPool, so new work cannot start. ASP.NET Core relies heavily on the CLR thread pool for almost every part of request processing, so when the pool is exhausted the entire application begins to stall even though CPU might be low and memory might look healthy. In some situations, your application might terminate and restart a process because it becomes overwhelmed.
In essence, it’s a thread availability problem rather than a CPU problem. Applications might appear “idle” in CPU metrics while being completely unresponsive because no worker threads are free.
How to Starve the Thread Pool
In the demo, the starvation is created by queuing 200 tasks, each of which blocks a thread with Thread.Sleep(60000). This simulates a real production scenario where a service collapses in slow motion because threads are being held hostage.
Here’s the code used in ProblemSimulator.cs to block just enough threads to cause problems in the demo’s App Service:
public static void StartThreadPoolStarvation()
{
	// Block 200 threads to make the app sluggish
	const int tasks = 200;
	const int sleepMilliseconds = 60000;

	for (var i = 0; i < tasks; i++)
	{
		Task.Run(() =>
		{
			// This blocks a thread pool thread for the full duration.
			Thread.Sleep(sleepMilliseconds);
		});
	}
}Thread blocking like this is a common one, but there are numerous scenarios that can cause thread blocking, such as:
- Synchronous I/O that waits on external resources.
- Locks that block lots of threads at once.
- Large parallel workloads that saturate and overwhelm the pool.
- Code paths that call
.ResultorTask.Waiton anasyncmethod.
The .NET Framework’s managed thread pool prevents too many threads being spun up at once. Think of it as self preservation. It attempts to balance the need for more threads with the cost of creating them, so it slowly adds workers only when it believes the system is genuinely saturated.
Running the Demo Code
Navigate back to the UI. Before we trigger the thread pool starvation task, press the Health check button a handful of times to get an idea of how quickly the server responds. This is visible in the durationMs JSON value (here, multiple clicks are averaging around 21ms):

Now trigger the thread pool starvation and run the health check a few more times. You should see that it is now much, much slower than before. Not only that, but the App Service’s metrics show the thread pool count skyrocketing:
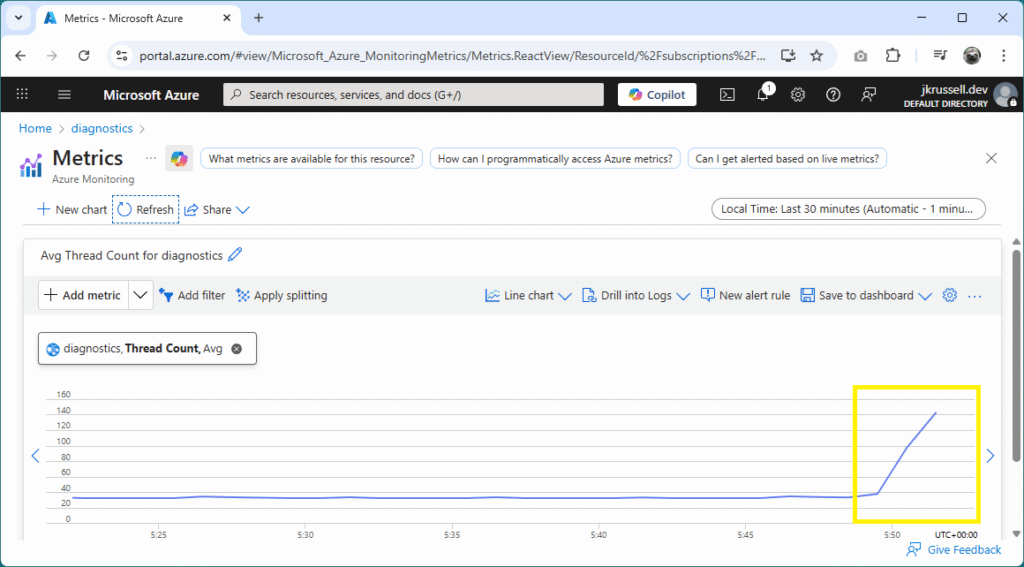
In a production scenario, this would manifest itself in real issues for users, with a high degree of latency as the application struggled to service requests in a timely manner.
Eventually, after a minute or so, the thread pool count should begin to decrease and response times for the health check should return back to normal.
Analysing the Memory Dump
If you haven’t already, download a fresh dump file around 30 seconds into the starvation and open it in Visual Studio and Debug Managed Memory. This time, things are relatively settled on the memory front:

Open Debug > Windows > Threads. There are 119, the majority of them sleeping:

This explains why the response time of health check requests has plummeted and why, in the real world, users would be left waiting for pages to load. Visual Studio is unable to point directly back to our code in this scenario because those arrays have already been deallocated from a reference point of view. They are present waiting for the next garbage collection, and the debugger can’t attribute them to any live root.
Thread Pool Starvation in the Wild
Thread pool starvation is the silent one. CPU looks fine. Memory looks fine. Logs don’t scream. And yet the site becomes completely unusable. It’s easy to get caught out because starvation hides behind the metrics most people reach for first, which is why a thread list from a dump is often the only reliable indicator.
In the wild, a common cause of thread pool starvation is synchronous database access. For example, calling .Result or .Wait() on EF Core queries forces the request thread to block while waiting for I/O. It’s a real wince moment when you see it in developer code. If several requests do this at the same time, the thread pool becomes saturated with sleepers. The CPU graph looks perfectly healthy, but the application slows to a crawl because there are no free workers to handle new requests.
When to Use Profiling vs Full Dumps
Profiling is ideal when you can reproduce the issue easily and want to see live call stacks with CPU attribution. Full dumps are ideal when the site is unresponsive, hanging, or leaking memory over time. In a real production incident you’ll often use both: profile to understand the behaviour, dump to inspect the exact heap or threads that caused it.
Final Thoughts
Working through these scenarios shows how powerful Kudu can be when you pair it with Visual Studio’s diagnostic tools. CPU spikes, memory leaks, memory bombs and thread pool starvation all look different in metrics, in dumps and in profilers, but they become super easy to debug if you know what tools to use and what to look out for. Hopefully you found each one useful, and remember: the same techniques apply to real production incidents. If a site is slowing down or recycling for no obvious reason, profiling snapshots, full dumps and a look at the thread pool or heap can pinpoint the root cause in no time.
All of the code examples used here are available in my GitHub repo: Azure Kudu Diagnostics Demo. And if you missed my previous Kudu Console post, check out Troubleshooting Azure App Services API and Network Problems – a practical take on diagnosing common issues.
A really interesting article. Thanks for posting. I think it will be really interesting to see how Agentic AI tooling can help to not just diagnose but potentially resolve these issues in future, with the SRE agent (https://azure.microsoft.com/en-us/products/sre-agent) which ships with a collaboration with a GitHub Copilot coding agent. You could probably even hook this into a Jira, Azure DevOps or GitHub Issues backlog to get a ticket created (if you have a memory leak, for example), and then get an autonomous agent to commit back to your GitHub repo and deploy a fix.
Hi, great blog, read this post and also the one about Cancellation tokens. A feedback is that the floating shapes are very distracting when reading, it disrupts the flow.
Best Regards
Joakim
Thanks for the feedback, Joakim. I totally agree with you, so I’ve turned off the flying shapes. 🙌🏼